Core Styling Elements
When you add a new layer to your project, it is assigned a default style depending on the type of data. By customizing the Layer design  menu, you can adjust the visualization of the datasets to your wishes and create appealing maps. The styling options available depend on the type of data, i.e. whether it is points, lines or polygons. Thereby, multiple visual aspects, such as colors, strokes and opacities can be adjusted.
Color Settings
Fill Color
Fill color is used to represent the interior of point or polygon features on a map. Fill color is an aspect of cartography and GIS visualisation because it helps to improve the overall readability of the map. The Color Picker provides different options to select the colors of your choice.
Opacity
To adjust the opacity of your layer styles for fill color, simply change the opacity to any value between 0 and 1. This numerical scale allows you to define the exact level of opacity you want, where 0 is full transparency and 1 is full opacity. Adjust the opacity to your preference, either by using the slider or by typing the exact level directly into the text box provided.
Stroke Color
Similar to the fill color, also the stroke color can be adjusted. Stroke color refers to the color applied to the outlines or edges of map features such as polygons, lines and points. It is used to delineate the edges of spatial entities, distinguishing them from one another and enhancing their visibility on the map. The Color Picker provides different options to select the colors of your choice.
Color Picker & Preset Colors
Whenever you want to change a color, may it be Fill Color or Stroke Color, the color menu opens. You can either set the colors from the Color Picker by moving the picker in the color field or by defining hex code or RGB values, or you can select one of the colors we provide in the Preset Colors.

Custom Marker
For point layers, Custom Markers can be used for the visualization. Therefor, the marker can be selected from an icon list. The Marker Size can be adjusted via the slider.
Width & Radius
Stroke Width
Besides the color, also the line thickness of strokes can be defined. Adjust the line width to your preference, either by using the width slider or by typing the exact size directly into the text box provided.

Radius
For point datasets, the radius can be adjusted. Therefore, you can either use the Radius slider to make incremental changes, or enter the desired radius size directly in the text box for precise control.

Default Settings
By clicking on the three dots  , the default style settings open.
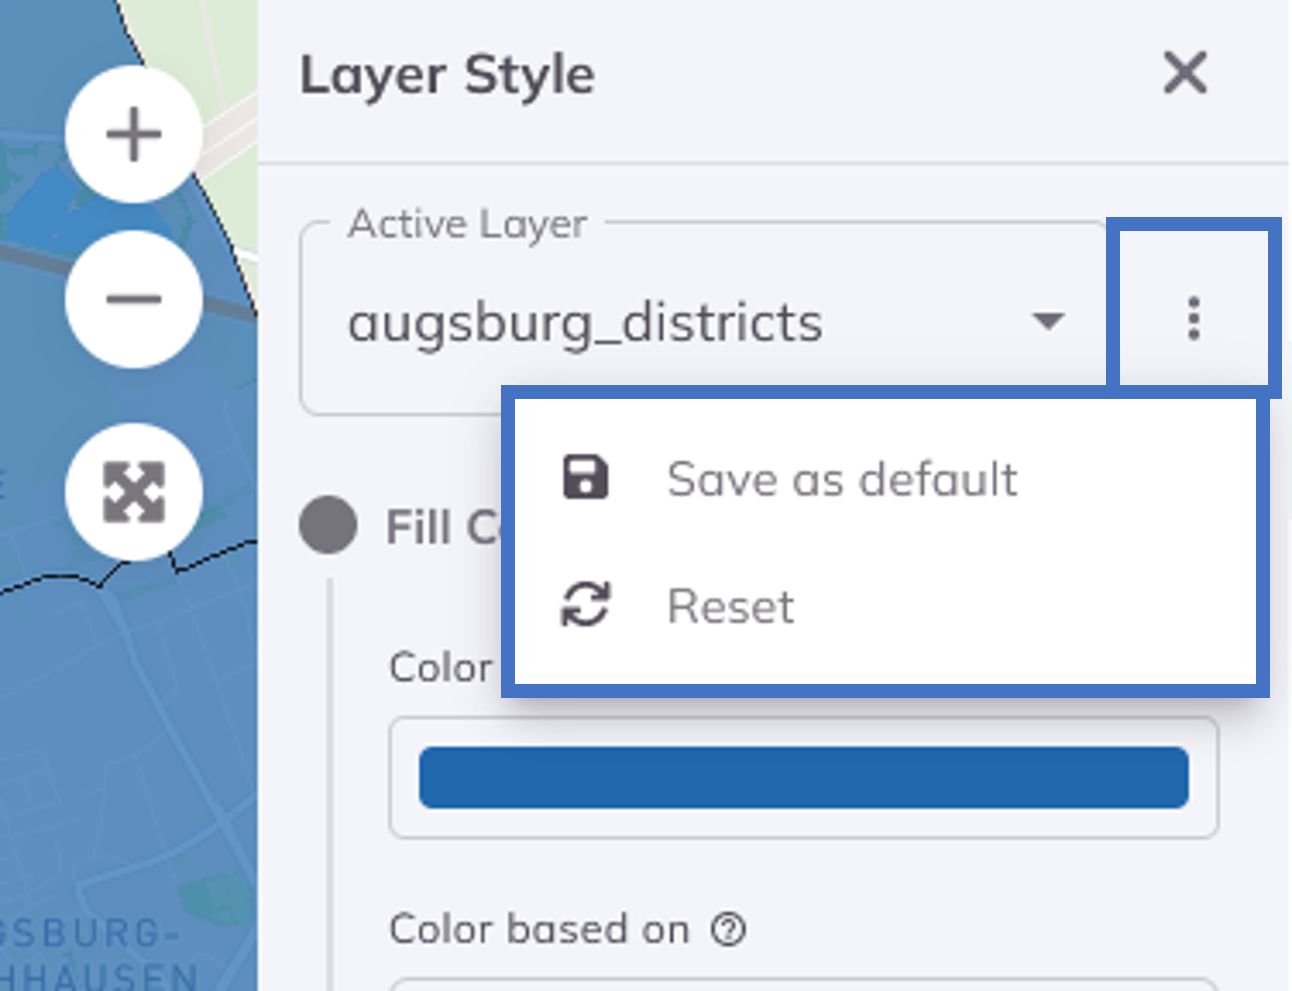
If you select Save as default, the current style settings will be attached to the dataset. Whenever you add this dataset to a project, this default style will be used (Note: existing projects where this dataset is displayed will not be effected).
By clicking on Reset, you can reset the current style settings back to the default.
Interested in smart styling options? Check our Attribute-based Styling.